In the dynamic world of cross - border e - commerce, data is the key to understanding market trends, customer behavior, and ultimately, driving sales. Visualization of this data has emerged as a powerful tool that can transform complex datasets into actionable insights. In this blog post, we will explore the power of a DeepSeek - based data visualization solution for cross - border e - commerce sales.
1. Introduction to Cross - border E - commerce
Cross - border e - commerce has witnessed exponential growth in recent years. With the globalization of markets and the increasing ease of international trade, more and more businesses are venturing into selling their products and services across international borders. This expansion brings with it a plethora of opportunities as well as challenges. On one hand, businesses can access a much larger customer base, tap into new markets with different consumer preferences, and potentially increase their revenue streams. On the other hand, they face issues such as dealing with different regulatory frameworks, cultural differences, and intense competition.
In this highly competitive landscape, having a clear understanding of sales data is crucial. Sales data in cross - border e - commerce encompasses a wide range of information, including product sales volumes in different regions, customer demographics, purchasing patterns at different times of the year, and more. Analyzing this data manually can be a daunting task, given its volume and complexity. This is where data visualization comes into play.
2. The Importance of Data Visualization in Cross - border E - commerce
2.1. Simplifying Complex Data
Data visualization simplifies complex data sets by presenting them in a graphical format. For cross - border e - commerce sales data, which can include multiple variables such as country - specific sales, product categories, and time - based trends, visualization tools can transform these into easy - to - understand charts, graphs, and maps. For example, a bar chart can show the comparison of sales volumes of different product categories in various countries. This visual representation allows decision - makers to quickly grasp the main trends and patterns without having to sift through rows and rows of numbers.
2.2. Identifying Trends and Patterns
By visualizing sales data over time, businesses can identify trends and patterns that are not immediately apparent from raw data. For instance, a line graph depicting monthly sales of a particular product line across different countries may show a seasonal pattern in some regions but not in others. This information can be used to optimize inventory management, marketing campaigns, and pricing strategies. If a product has a high - demand season in a particular country, the business can plan to increase inventory levels and run targeted marketing campaigns during that time.
2.3. Facilitating Decision - making
In the fast - paced world of cross - border e - commerce, timely decision - making is essential. Data visualization provides decision - makers with a clear and concise view of the data, enabling them to make informed decisions quickly. For example, if a visualization shows that a certain product is not selling well in a particular market despite significant marketing efforts, the business can decide to either re - evaluate the product's positioning, modify the marketing strategy, or even consider discontinuing the product in that market.
3. DeepSeek: An Overview
DeepSeek is a cutting - edge technology that has been making waves in the field of data analysis and visualization. It is designed to handle large - scale data processing and extraction of meaningful insights.
3.1. Deep Learning Capabilities
DeepSeek utilizes deep learning algorithms to analyze data. Deep learning is a subset of machine learning that is based on artificial neural networks. These neural networks are capable of learning from large amounts of data and can identify complex patterns. In the context of cross - border e - commerce sales data, DeepSeek can analyze historical sales data, customer reviews, and other relevant data sources to uncover hidden patterns and relationships. For example, it can find correlations between customer satisfaction levels in different countries and the sales of specific product categories.
3.2. Scalability
One of the key features of DeepSeek is its scalability. As cross - border e - commerce businesses grow and their data volumes increase, DeepSeek can handle the additional load without sacrificing performance. It can scale horizontally by adding more computing nodes to the system, allowing it to process vast amounts of sales data from multiple regions and product lines efficiently.
3.3. Customizability
DeepSeek is highly customizable, which is essential for cross - border e - commerce applications. Different businesses may have different requirements in terms of the data they want to visualize and the insights they are seeking. DeepSeek can be tailored to meet these specific needs. For example, a business may want to focus on visualizing the sales data of a particular product family across a select group of countries. DeepSeek can be configured to extract and visualize only this relevant data.
4. The DeepSeek - based Data Visualization Solution for Cross - border E - commerce Sales
4.1. Data Collection and Integration
The first step in the DeepSeek - based solution is data collection and integration. Cross - border e - commerce sales data is typically scattered across multiple sources, such as e - commerce platforms, customer relationship management (CRM) systems, and logistics providers. DeepSeek has the ability to collect data from these diverse sources and integrate them into a unified data repository. This ensures that all relevant data is available for analysis and visualization. For example, it can pull in sales transaction data from the e - commerce platform, customer contact information from the CRM system, and shipping details from the logistics provider.
4.2. Data Pre - processing
Once the data is collected, it needs to be pre - processed. This involves cleaning the data to remove any errors, duplicates, or missing values. DeepSeek uses advanced data cleaning techniques to ensure the quality of the data. It also normalizes the data, for example, converting different date formats into a standard format. After pre - processing, the data is ready for analysis.
4.3. Visualization Creation
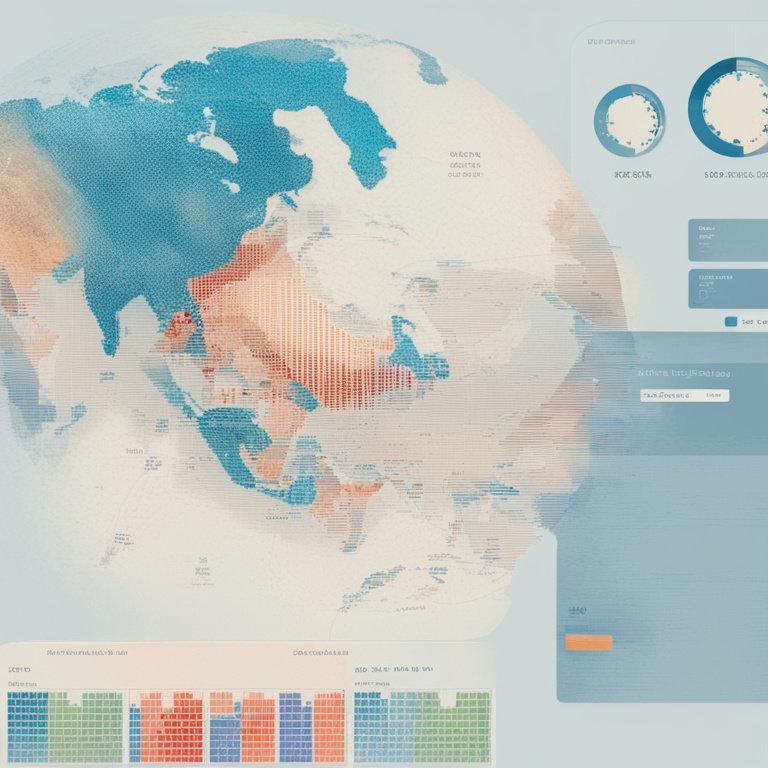
DeepSeek offers a wide range of visualization options. For cross - border e - commerce sales data, it can create various types of visualizations such as geographical maps to show sales distribution across different countries, pie charts to display the proportion of different product categories in total sales, and line graphs to illustrate sales trends over time. These visualizations are interactive, allowing users to drill down into the data for more detailed information. For example, clicking on a particular country on a geographical map can show the sales breakdown by product category in that country.
4.4. Insights Generation
In addition to creating visualizations, DeepSeek generates insights from the data. It uses its deep learning algorithms to analyze the visualized data and provide actionable recommendations. For instance, if it detects a decline in sales of a certain product in a particular region, it may suggest possible reasons such as increased competition, changes in consumer preferences, or ineffective marketing. It can also recommend strategies to boost sales, such as launching a new marketing campaign, adjusting the product price, or introducing a new product feature.
5. Case Studies
5.1. Company A: Expanding into New Markets
Company A, a medium - sized cross - border e - commerce business, was looking to expand into new international markets. However, they were unsure which markets held the most potential. By implementing the DeepSeek - based data visualization solution, they were able to analyze their existing sales data in different regions. The visualizations showed that certain emerging economies had a growing demand for their product category, but their market share was relatively low. With the insights generated by DeepSeek, they developed a targeted marketing strategy for these markets, adjusted their product offerings to better suit local preferences, and saw a significant increase in sales within a year.
5.2. Company B: Optimizing Inventory Management
Company B was struggling with inventory management in their cross - border e - commerce operations. They often had overstocked or understocked products in different regions. Using the DeepSeek solution, they visualized their sales data along with inventory levels. The visualizations clearly showed the seasonal patterns of sales in different countries and the corresponding inventory requirements. Based on these insights, they were able to optimize their inventory management system, reducing inventory holding costs and minimizing stock - outs.
6. Challenges and Solutions in Implementing the DeepSeek - based Solution
6.1. Data Security
One of the main challenges in implementing the DeepSeek - based solution is data security. As cross - border e - commerce data contains sensitive information such as customer details and financial transactions, ensuring its security is of utmost importance. To address this, DeepSeek employs advanced encryption techniques during data collection, storage, and transmission. It also has strict access control mechanisms in place, allowing only authorized personnel to access the data.
6.2. Integration with Existing Systems
Many cross - border e - commerce businesses already have existing systems in place, such as e - commerce platforms and CRM systems. Integrating the DeepSeek solution with these existing systems can be a challenge. DeepSeek offers seamless integration capabilities, with pre - built connectors for popular e - commerce and CRM platforms. In addition, it provides customization options to ensure a smooth integration process according to the specific requirements of each business.
6.3. User Training
For the effective use of the DeepSeek - based data visualization solution, user training is essential. Since the solution may be new to the employees of the cross - border e - commerce business, they need to be trained on how to interpret the visualizations and act on the insights generated. DeepSeek offers comprehensive training programs, including online tutorials, in - person training sessions, and user manuals to ensure that users can make the most of the solution.
7. Conclusion
The DeepSeek - based data visualization solution for cross - border e - commerce sales offers a powerful way to unlock the potential of sales data. By simplifying complex data, identifying trends and patterns, and generating actionable insights, it can help cross - border e - commerce businesses make more informed decisions, optimize their operations, and ultimately increase their sales and competitiveness in the global market. While there are challenges in implementing the solution, such as data security, integration with existing systems, and user training, these can be effectively addressed with the appropriate measures. As cross - border e - commerce continues to grow and evolve, data visualization solutions like DeepSeek will play an increasingly important role in driving business success.